How to calculate NPS - Net Promoter Score calculation guide
Learn how to calculate your Net Promoter Score with our easy-to-follow guide, including expert-certified NPS templates and global industry benchmarks.

Net Promoter Score® (NPS®) is a common metric used to evaluate customer experience (CX) and loyalty. It measures customers' satisfaction with a company and their willingness to recommend it to others.
This guide explains how to calculate your NPS accurately, from understanding the basic formula to analyzing the results of your NPS survey. We’ll provide the methodology for calculating your score and how to use this data to improve customer relationships.
How does the Net Promoter Score work?
Net Promoter Score operates through a straightforward survey model. Organizations send out a survey with the core NPS question: "How likely would you recommend this company to a friend or colleague?"

To gain further insights, companies often ask one or two follow-up questions, like "What could we do to improve your experience?" or "What did you appreciate most about our service?" These questions provide valuable context to the initial response, helping pinpoint strengths and areas for improvement.
Related: NPS survey template
How to interpret the NPS scale
The NPS scale categorizes respondents into three groups based on their loyalty and satisfaction. Each category is defined by how respondents answer the core NPS question.
Here's a breakdown of each group:
- Detractors (0-6): Unsatisfied customers, unlikely to make repeat purchases, and may even dissuade others. Understanding their grievances can inform specific improvements to transform the customer experience.
- Passives (7-8): Satisfied but unenthusiastic customers who could switch to competitors for better deals or features. While not vocal detractors, their loyalty hangs in the balance and can shift based on your actions.
- Promoters (9-10): These are your brand advocates. They recommend your business to others, organically boosting your reputation. Continuously enhancing their experience helps maintain their enthusiasm and prevents them from becoming passive.
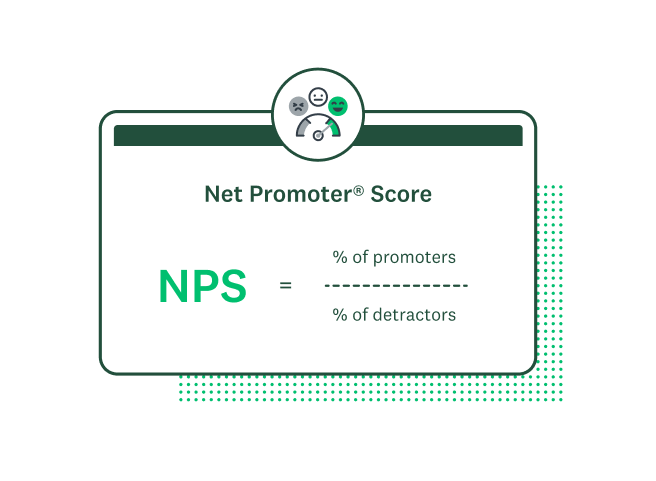
The NPS formula
To calculate your NPS score, subtract the percentage of detractors from the percentage of promoters (% of promoters - % of detractors.)
Here's our step-by-step breakdown:
- Identify promoters and detractors: From your survey, count the responses that fall into the promoter category (scores of 9-10) and the number of detractors (scores of 0-6).
- Ignore the passives: Passives (scores of 7-8) are not included in the NPS calculation. They represent neutral feedback and do not directly affect the loyalty metric as promoters or detractors do.
- Calculate percentages: Find the percentage of both promoters and detractors. Divide the number of promoters and detractors by the total responses, then multiply by 100.
- Apply the formula: Subtract the percentage of detractors from the percentage of promoters. This result is your NPS.
Imagine you received 100 responses to your NPS survey:
- 70 are promoters
- 20 are passive
- 10 are detractors
Promoters are 70%, and detractors are 10%. Subtracting 10% from 70% gives an NPS of 60.
Calculating NPS for 100 respondents is easy. However, as your survey size increases, the calculation can become complex. When you use the SurveyMonkey NPS template, the built-in NPS calculator calculates these scores automatically, ensuring you get 100% accurate results faster.
What's a good Net Promoter Score?
Determining a good Net Promoter Score isn't straightforward because it varies by industry, company size, and market context.
Here are five key points to consider when benchmarking your NPS score:
- Global Benchmarks:
- Average NPS: The global NPS average is +32.
- Median NPS: The median is +44, indicating half score below and half score above this figure.
- Performance Quartiles:
- Lower quartile (bottom 25% of performers): 0 or lower
- Upper quartile (top 25% of performers): +72 or higher
- Industry-specific benchmarks:
- Professional Services: Average NPS of +43, with top performers reaching +73 or higher.
- Technology Companies: Average NPS of +35, top quartile scoring +64 or higher.
- Consumer Goods and Services: Similar to professional services, with an average NPS of +43 and top performers at +72 or higher.
- Comparison with industry peers:
- You should view a good NPS relative to industry norms. For example, technology firms generally score lower than consumer services.
- Measure your NPS performance with SurveyMonkey Benchmarks to determine where you stand in the global competitive landscape.
- Context Matters:
- Customer experience variation: Different industries provide varied levels of customer satisfaction. For example, customer satisfaction surveys show that subscription TV is often rated lower than internet retail.
- Target performance: If your score is above the industry average or median, you are likely outperforming many competitors. Conversely, identifying areas for improvement is crucial if you're below average.
Comparing your score to these NPS benchmarks clarifies where your company stands and highlights potential areas for improvement to enhance customer loyalty and satisfaction.
How to use your NPS score
Once you've calculated your Net Promoter Score, leveraging this metric to drive improvements and foster business growth is crucial. Here are practical best practices to use your NPS effectively:
Share NPS results with stakeholders
Why this matters: Sharing NPS insights ensures relevant teams understand customer sentiments and align to improve the customer experience.
Regularly share detailed reports with teams that can benefit most, such as customer experience and sales teams. These reports should highlight key data points and insights that showcase the importance of NPS data.
Create an action plan
Why this matters: Action plans based on NPS feedback can directly influence improvements in customer service and product offerings, enhancing overall satisfaction.
Analyze NPS data to identify common trends and areas needing attention. Develop targeted strategies to address issues highlighted by detractors and enhance aspects that promoters value.
Continuously monitor your Net Promoter Score
Why this matters: Continuous monitoring allows businesses to gauge the effectiveness of implemented changes and make adjustments as customer expectations evolve.
Regular NPS surveys allow you to track changes and trends as your company evolves. Determining your ideal interval will depend on your business and industry. For example, a tech company with many product releases may want to conduct NPS surveys quarterly.
Leverage NPS insights
Why this matters: Aligning business strategies with customer feedback can lead to higher customer satisfaction and loyalty, ultimately driving growth and profitability.
Use insights from NPS data to guide decisions in product development, customer service improvements, and marketing strategies. By focusing on specific customer pain points identified through NPS, businesses can effectively boost user experience and foster growth.
Calculate and measure your NPS with SurveyMonkey
Understanding how to calculate your Net Promoter Score is essential for assessing customer loyalty and identifying opportunities to enhance their experience. Through a straightforward NPS calculation, you gain valuable insights into where your company stands with customers and can measure your performance against competitors.
SurveyMonkey simplifies this process with an expert-certified NPS survey template. Effortlessly conduct NPS surveys, automatically calculate your score, and compare results against industry benchmarks. Sign up to boost customer loyalty with an NPS survey from SurveyMonkey.
NPS, Net Promoter, and Net Promoter Score are registered trademarks of Satmetrix Systems, Inc., Bain & Company, and Fred Reichheld.
Discover more resources

Customer satisfaction survey templates
Explore our customer satisfaction survey templates to rapidly collect data, identify pain points, and improve your customer experience.

3 ways to boost business growth by connecting SurveyMonkey and HubSpot
See how users are taking action on survey data to improve customer experience with the SurveyMonkey app for HubSpot.

How to use Forms to enhance your survey experience
How do surveys and forms differ? Learn how to combine form data with survey feedback for seamless events and experiences.

Beyond CX: How SurveyMonkey + Salesforce turn feedback into revenue
SurveyMonkey + Salesforce turn feedback into revenue